
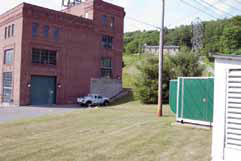
One aspect of the science of global warming is the measurement of ground temperature on a local basis. This is followed by placing the data on a worldwide grid and extrapolating to areas that don’t have data. The local measurement site in the northwest corner of Connecticut is in Falls Village, near the old powerhouse. The data from that site appears to start in 1916 according to NASA records; it shows intermittent warming of about 0.5 degrees C over the last 100 years. However, NASA recently decided to modify that data in a direct display of political convenience to exaggerate the current rate of warming. What follows is a look at the data record as given on the site for NASA Goddard Institute of Space Studies (GISS), a look at alternate facts.
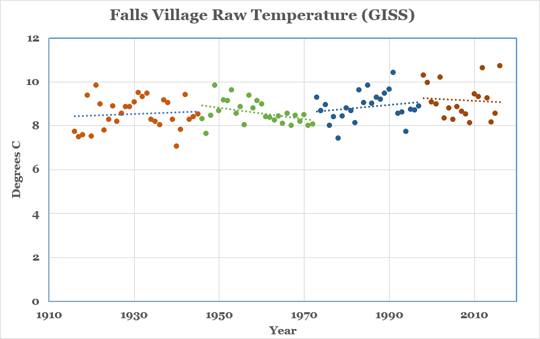
The plot of the measured temperatures for 101 years in Falls Village is shown. Although there is routinely a great deal of variation from year to year, several trends can be separated from the plot. A small, but noticeable increase occurs from 1916 through about 1950. Then, the temperature decreases until 1972 with much less volatility. Then, the temperature increases again until roughly 1998 when it holds steady until the present. However, the present volatility is very high.
The El Nino (a change in ocean currents with corresponding atmospheric changes) in 1998 and 2016 is very visible, but not unique in Falls Village. (Please note the Wikipedia editing on the subject of climate change is tightly controlled by a small group of political hacks so real science cannot be introduced on that site.)
Also remember that the actual temperature will vary from approximately -10 to over 35 degrees C so how the averages are done is important. To understand the plot takes effort, but it puts the later changes in context.
The temperature data for a given station (site) appears as monthly averages of temperature. The actual data from each measurement (daily?) is not present, making independent analysis impossible, a well-known problem with GISS data. The calculation of an annual temperature is specified by GISS. A reasonable summary includes several steps.
Although the data set is not labeled, these measurements are presumably min/max measurements. The monthly numbers include the average of at least 20 measurements of temperature for each month. Then the monthly averages are combined to get a seasonal mean (quarters) starting with December. Then these four quarters are averaged to get an annual mean.
The entire data set is also subjected to composite error correction by calculating the differences of each data point from its monthly mean (the monthly anomaly). Then the seasonal correction is the average of the appropriate monthly corrections and the yearly correction the average of the seasonal corrections. The net of these corrections is added to the average. The result is an annual “temperature” which is a measure of the energy in the atmosphere coupled with any direct radiation impingement.
Sometime in the last few years, just before the Paris Conference on Climate Change, GISS decided to modify the temperature data to account for perceived faults in its representation of atmospheric energy. While the reasons for change are many, the main reason given appeared to be urban sprawl into the measurement sites. They said, “GISS does make an adjustment to deal with potential artifacts associated with urban heat islands, whereby the long-term regional trend derived from rural stations is used instead of the trends from urban centers in the analysis.” Falls Village is a small rural town of approximately 1100 people, mostly farm land.
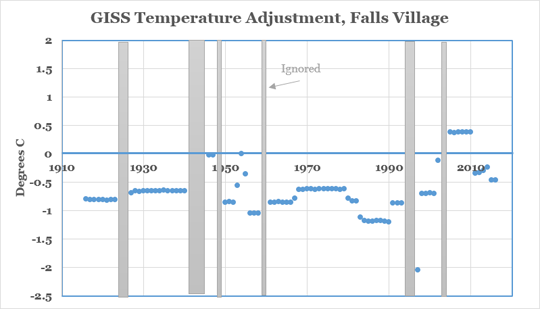
The plot of all the changes to the raw temperature data from Falls Village is shown above. First, of course, several sections of data are ignored presumably because of some flaw in the collection of data, equipment malfunctions, or other concern although the data is clearly present in the raw experimental record. Second, almost all of the temperatures before 1998 are reduced by 0.6 to 1.2 degrees C which makes the current temperatures look artificially higher. There appears to be no good scientific reason to change instrumental data like this. Curiously, these changes tend to fit the narrative of no pause in global warming that was touted by GISS rather than an 18 year pause actually measured.
Further, if the reasoning of GISS is taken at face value, the apparent temperatures of New York City would be effected by extrapolation. Falls Village (actually the Town of Canaan, Connecticut) is about two hours outside of the City and would be part of the rural weighting for NYC temperatures.
Update: The actual raw data, in hard copy not electronic form, is at: https://www.ncdc.noaa.gov/IPS/coop/coop.html?_page=2&state=CT&foreign=false&stationID=062658&_target3=Next+%3E